Reinforcement Learning Gradients as Vitamin for Online Finetuning Decision Transformers
Kai Yan, Alexander G. Schwing, Yu-Xiong Wang
NeurIPS, 2024 (Spotlight)
Vancouver, Canada
PDF | Code | Poster | Slide | Bibtex | Supplementary Figures
Decision Transformers falter still,
When fine-tuned on low-return will.
We prove the cause, the gap revealed,
A pill of TD3, and it's healed.
- GPT-4o
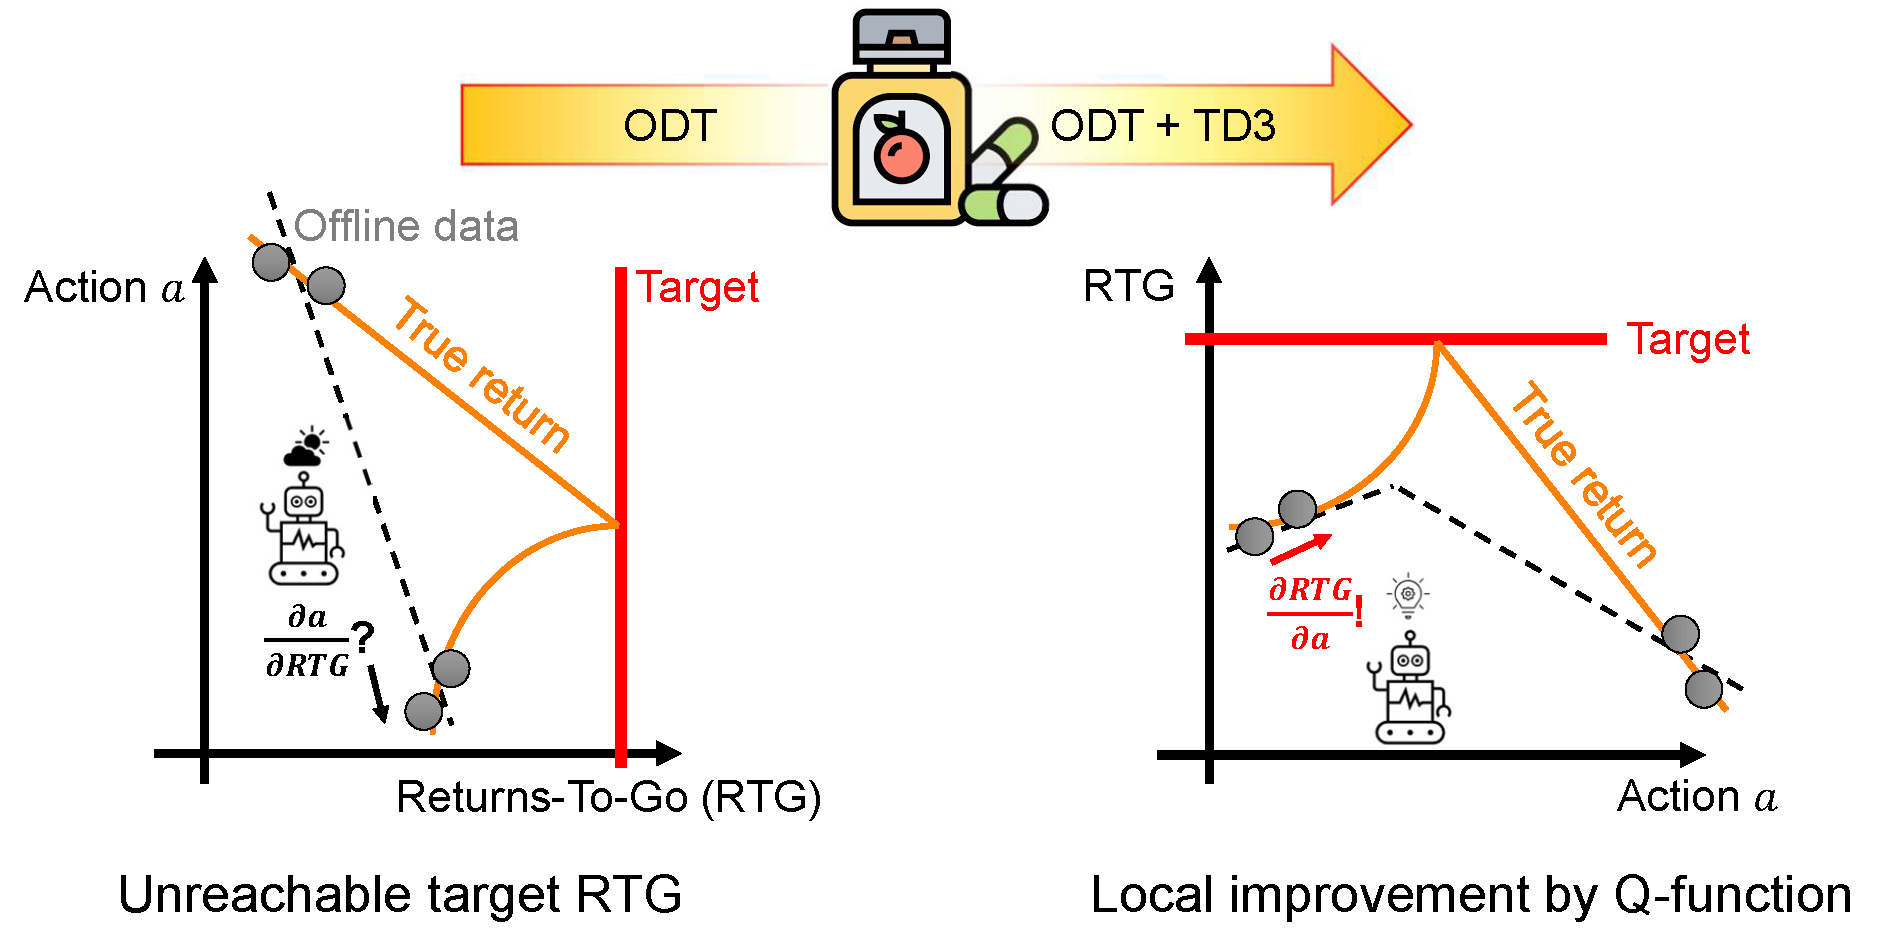
How Does Decision Transformers Falter?
Inspired by recent success of autoregressive training, Decision transformers is proposed as a novel RL paradigm where it sees state, action and Return-To-Go (RTG) trajectories as a sequence to predict. However, there has been surprisingly few work that tries to finetune such algorithm with online data.
Online Decision Transformer (ODT) [1], the most prominent solution, sets a high, target RTG and let the agent generate trajectories conditioning on such RTG to get higher return data. However, if the pretrain data all have low return (illustrated above as grey points), then the policy for generating trajectories with high RTG (corresponds to the reward peak in the middle) will be wildly out-of-distribution; in such case, the learned policy conditioning on high RTG (the dotted line on the left) will not lead to better performance.
Can we State This in a Theoretical Framework?
The intuition of proving the falter is to establish connections between the extent of out-of-distribution for the target RTG and the final performance. To do this, we use the tight performance bound for policy \(\pi\) proved by Brandforbrener et al. [2]:
$$\text{Target RTG} - \mathbb{E}_{\pi}[\text{actual RTG}] \leq \epsilon(\frac{1}{\alpha_f}+2)H^2$$
,
where \(\epsilon\) is the environment noise, \(H\) is the episode horizon, and \(\alpha_f\) is the probability of achieving target RTG. By Chebyshev inequality, we prove that \(\frac{1}{\alpha_f}\) grows superlinearly with respect to target RTG; i.e., \(\epsilon(\frac{1}{\alpha_f}+2)H^2\) grows faster than target RTG. Thus, to ensure tightness, the \(\mathbb{E}_{\pi}[\text{actual RTG}]\) term must decrease to fit in.
What is the Cure Then?
As we mentioned, out-of-distribution target RTG is the reason why ODT struggles with low-return offline data. As we have no oracle to bring trajectories with target RTG in sample distributions, we should consider local improvement with respect to RTG; i.e., get \(\frac{\partial \text{RTG}}{\partial a}\) for the current policy. This is infeasible for ODT since the actor gives non-invertible \(\frac{\partial a}{\partial \text{RTG}}\); however, such gradient can be provided by traditional RL, e.g., TD3.
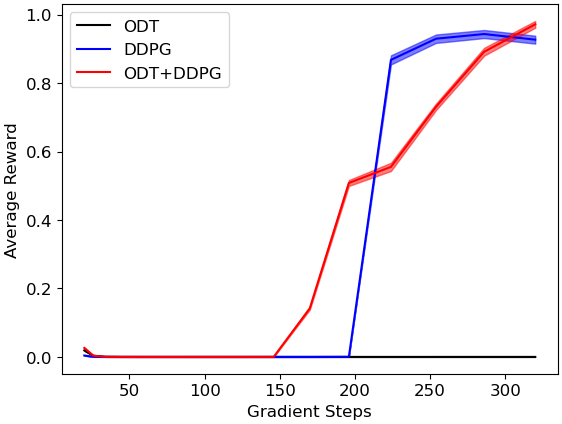
Performance of ODT, ODT+DDPG and DDPG on examples illustrated above
Policy learned by ODT (grey to black) vs. ODT+DDPG (red to brown) on examples illustrated above
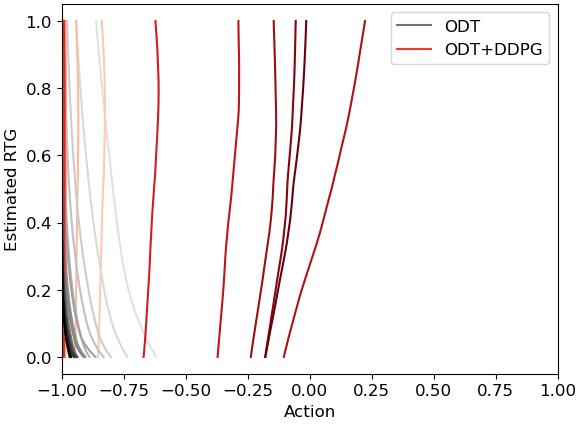
In the example illustrated above, 0 is the reward peak, while offline data are all on the two imbalanced feet of the return hill. ODT+DDPG finds the hidden reward peak while ODT fails.
Performance
We test our methods on multiple scenarios, including MuJoCo environments, Adroit environments, Antmaze environments and Maze2d environments, all from D4RL [3].
Adroit Environments ({pen, hammer, door, relocate}x{expert, human, cloned})
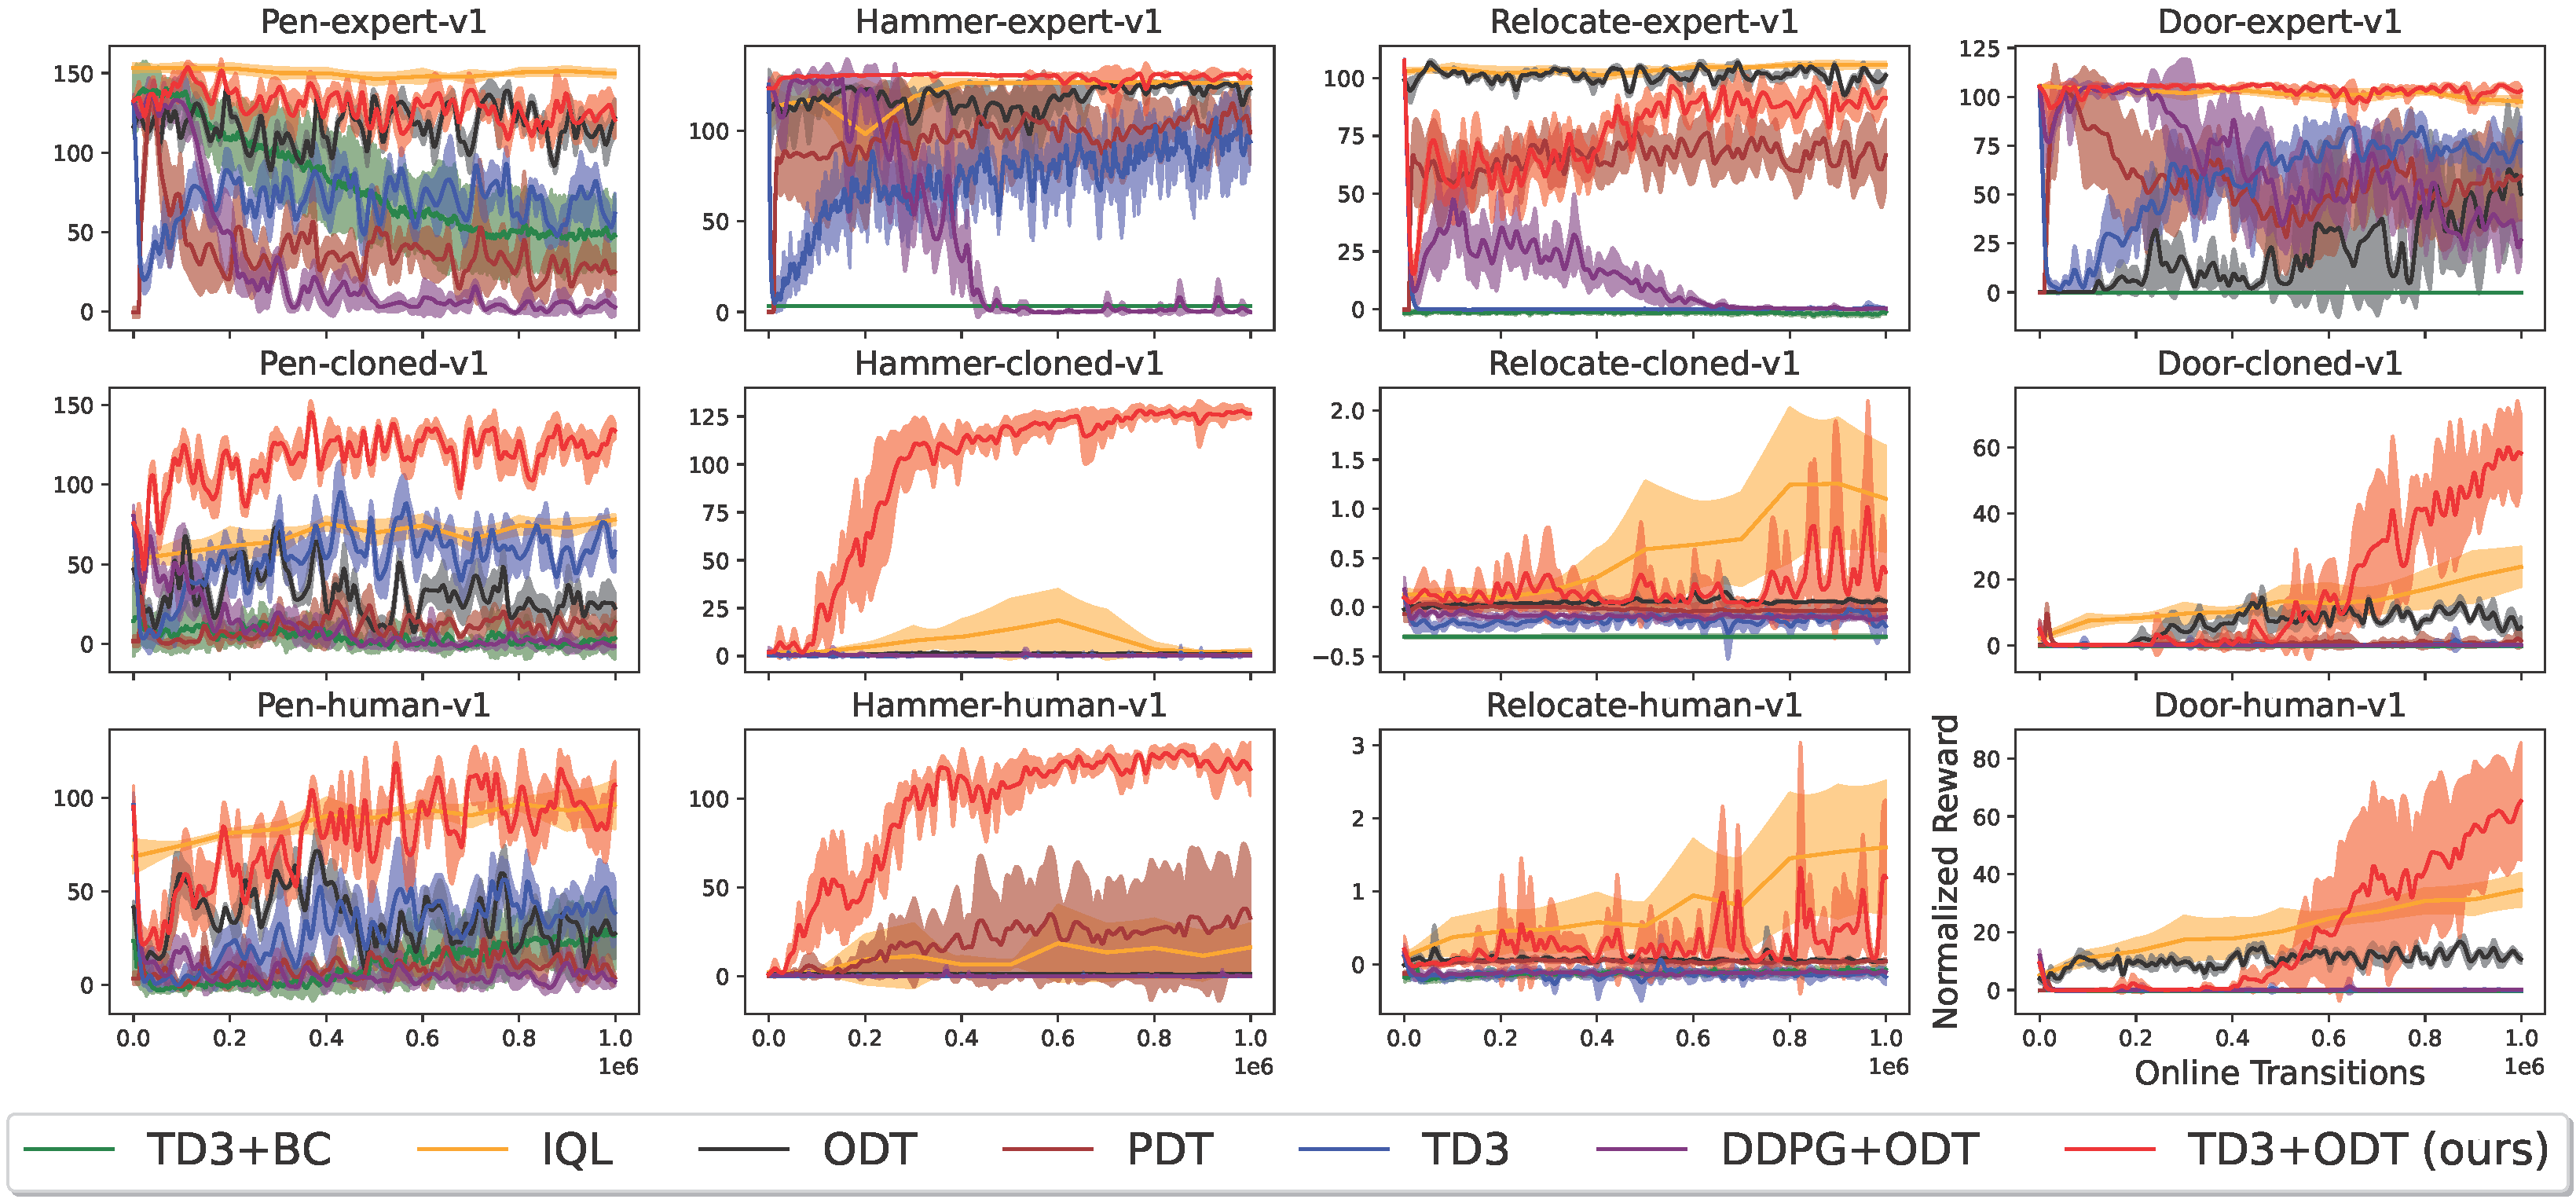
Reward curve (Higher is Better)

Statistics by the rliable (https://github.com/google-research/rliable) library with 10000 bootstrap replications. The x-axes are normalized scores, and IQM stands for InterQuatile Mean. Optimality gap is (100 - expectation of normalized reward capped at 100).
MuJoCo Environments ({hopper, halfcheetah, walker2d, ant}x{medium, medium-replay, random})
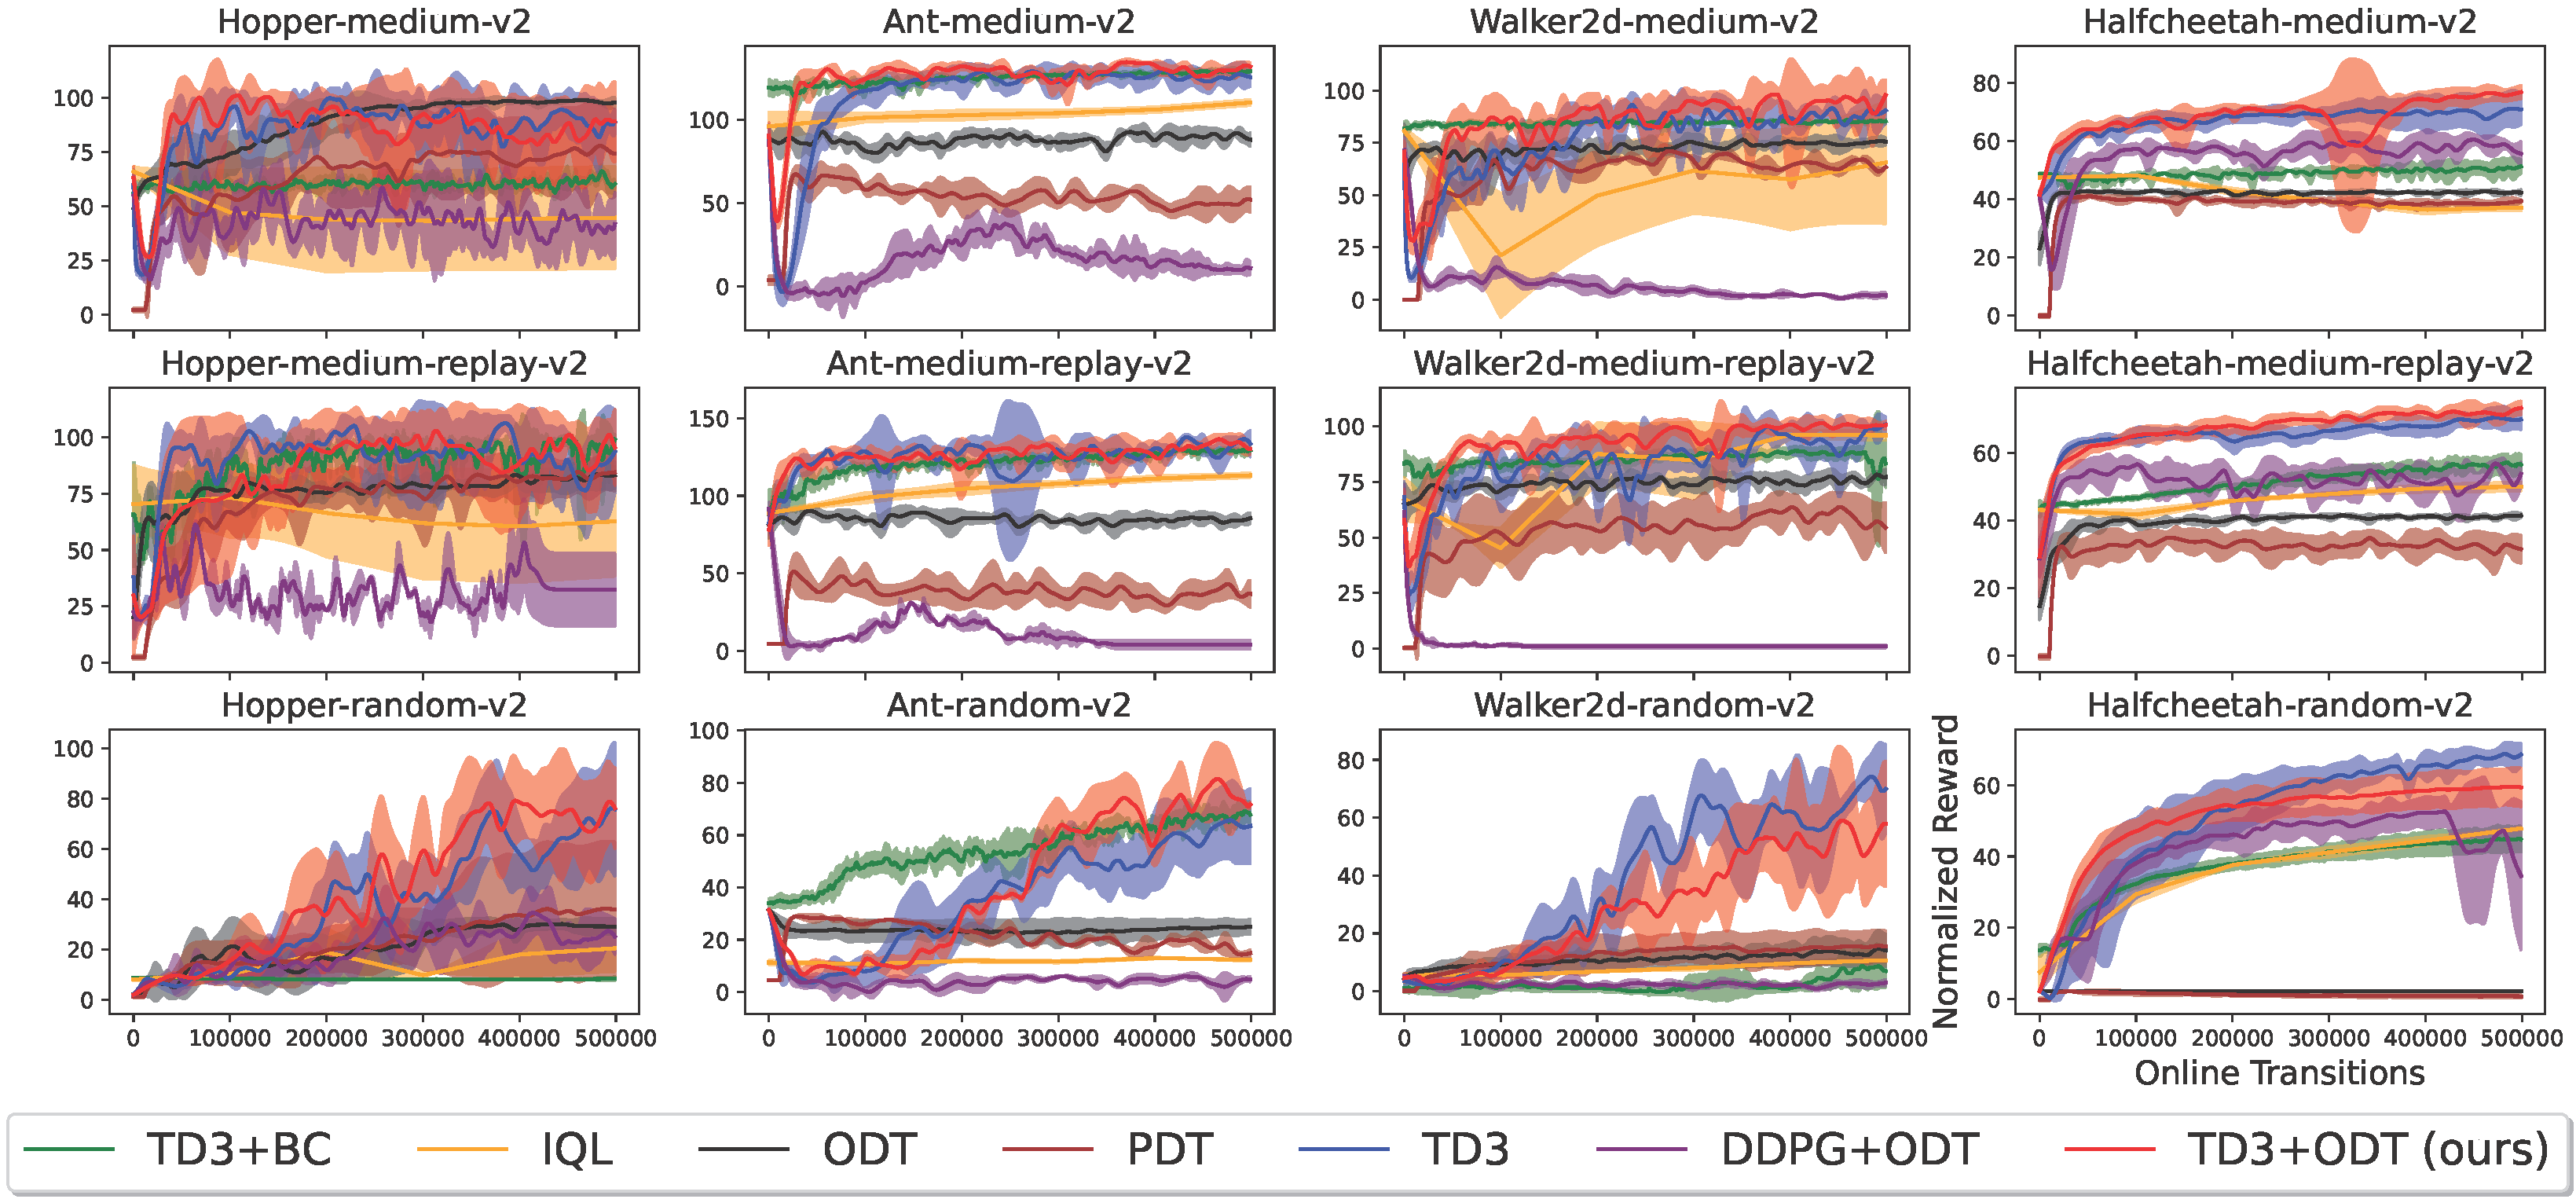
Reward curve (Higher is Better)

Statistics by the rliable (https://github.com/google-research/rliable) library with 10000 bootstrap replications. The x-axes are normalized scores, and IQM stands for InterQuatile Mean. Optimality gap is (100 - expectation of normalized reward capped at 100).
Antmaze Environments (umaze, umaze-diverse, medium-play, medium-diverse)

Reward curve (Higher is Better)

Statistics by the rliable (https://github.com/google-research/rliable) library with 10000 bootstrap replications. The x-axes are normalized scores, and IQM stands for InterQuatile Mean. Optimality gap is (100 - expectation of normalized reward capped at 100).
Maze2D Environments (open, umaze, medium, large)

Reward curve (Higher is Better)

Statistics by the rliable (https://github.com/google-research/rliable) library with 10000 bootstrap replications. The x-axes are normalized scores, and IQM stands for InterQuatile Mean. Optimality gap is (100 - expectation of normalized reward capped at 100).
We have also conducted extensive ablations in our paper, including context length, RL gradient coefficient tuning, environments with delayed reward, longer training process, using recurrent critic, other possible exploration improvement techniques and ablations on architecture.
Related Work
[1] Q. Zheng, A. Zhang, A. Grover. Online Decision Transformer. In ICML, 2022.
[2] D. Brandfonbrener, A. Bietti, J. Buckman, R. Laroche and J. Bruna. When does return-conditioned supervised learning work for offline reinforcement learning? In NeurIPS, 2022.
[3] J. Fu, A. Kumar, O. Nachum, G. Tucker and S. Levine. D4RL: Datasets for Deep Data-Driven Reinforcement Learning. ArXiv, 2020.